While many traders chase hot trends, I’ve discovered hidden opportunities on the most unexpected companies over the past few weeks — and they all had something in common...
Disruptions.
A disruption is basically when a lot of capital from big institutions is flowing into a position (usually options) that you’d otherwise think is nothing. For example, they might think a stock is going to go up, so they buy tons and tons of call options.
Of course, the big guys know that average traders could spot these disruptions if they aren’t careful. That would ruin their chances at profits. So they slowly build their positions under the market’s surface. Many people don’t see this happening.
But I’ve developed a technique called Statistical Disruptive Flow that helps me spot the first clues of these disruptions happening. By cross-checking my SDF with some other quick criteria, I can find great trades on companies you’d never think to look at.
Let me show you what this looks like in action with a few successful trades SDF — statistical disruptive flow — recently found.
Apple (NASDAQ: AAPL) took a nosedive in April 2020. Did Apple really change to such a degree that it was no longer a good company?
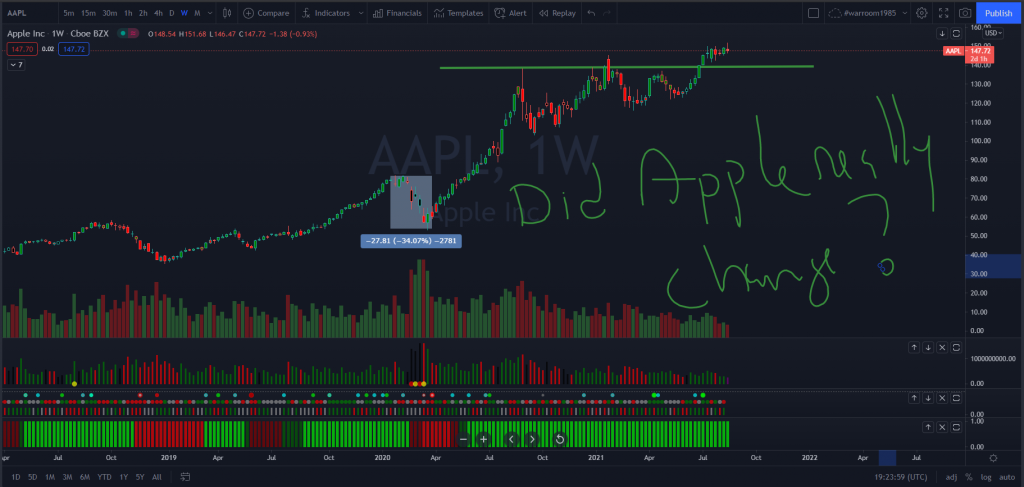
No! Of course not. A pandemic shut everything down. Everyone ran to protect themselves. It was only a matter of time before the institutions bought back in and Apple started climbing again.
Now that Apple’s reached record levels, most retail traders don’t think it can go any higher.
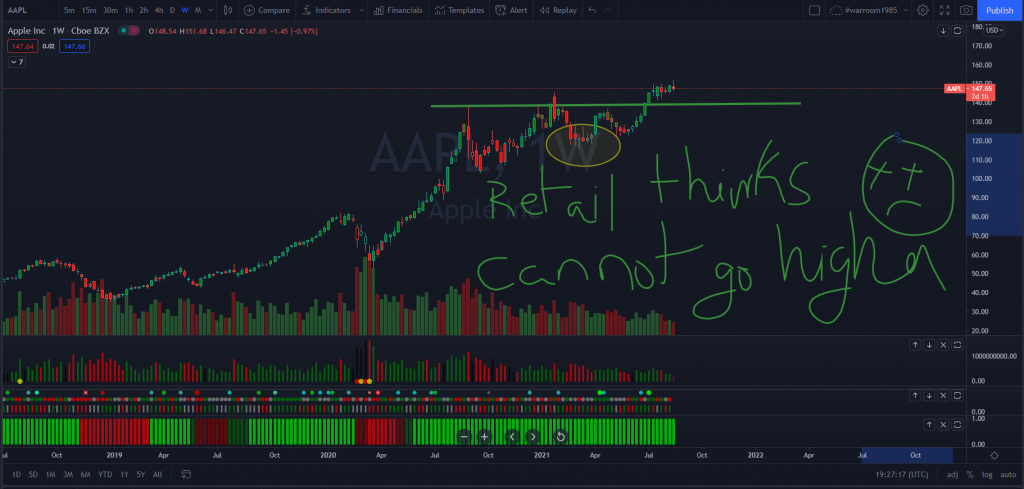
But they forget (or haven’t heard) about price rotation. In the most basic English, price rotation is the process of professional and institutional capital flowing in and out of certain asset classes or sectors at intervals.
Hence, the price goes up and down.
Unlike retail traders, I believed Apple was poised to continue upwards. In fact, since the 2nd half of 2020, I was looking at it hitting $174 per share. It was a matter of waiting for price rotation to continue nudging the stock upwards.
Then, a few SDFs activated in early June. I wasn’t ready to jump in yet — I waited a week before pulling the trigger.
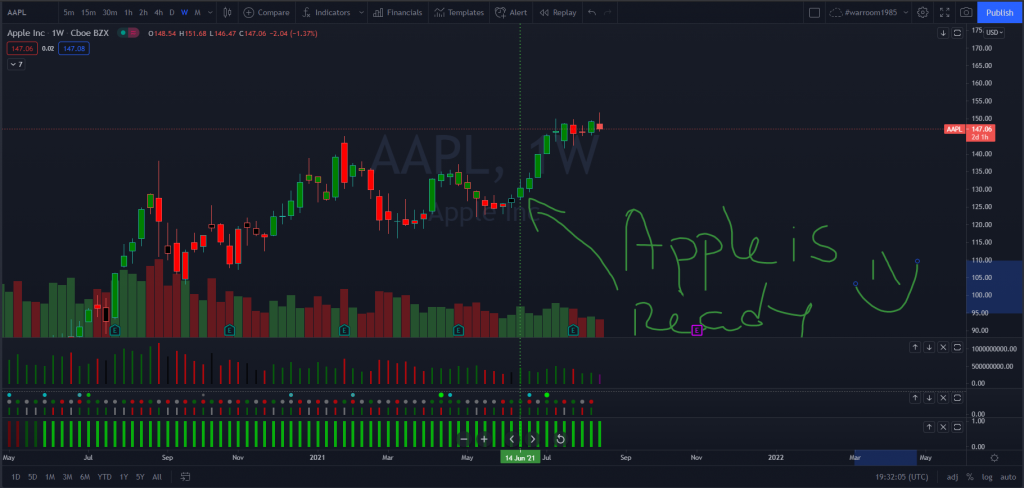
And Apple continued its ascent. Two weeks later, the stock had climbed enough for us to sell half our contracts at 100% gains.
Eventually, we sold the rest of the contacts for a 500% gain as Apple continued to increase. Altogether, that averages to 300% gains on Apple. By looking for disruptions, you can find profit opportunities on even the most boring of stocks.
Statistical Disruptive Flow alone doesn’t find me the winning opportunities. It only points me in the right direction.
You have to confirm the potential disruption with other factors. In this case, I had my eye on a few stocks due to macro-level trends.
You see, the chip shortage has been big news during 2021. But I saw it coming even before Jim Cramer. I read an NYT article talking about how Taiwan had become a semiconductor powerhouse. Taiwan Semiconductor Manufacturing Company (NYSE: TSM) in particular stood out to me, since they were the world’s first semiconductor foundry.
But there’s a problem: China-Taiwan tensions, another macro factor that’s been all over the news. TSM was way too risky. It’s not like they’re the only semiconductor firm out there, either — there are plenty that aren’t as exposed to geopolitical time bombs.
Instead, I opted for Advanced Micro Devices (NASDAQ: AMD), located safely inside America, because I firmly believe in American companies. I had a plan laid out for this company, too. I knew a trade would come eventually as the chip shortage carried on. But we had to wait for the right time to enter the position.
SDF — Statistical Disruptive Flow — told me it was time on April 25, so out went the trade alert, and in we went on the options trade.
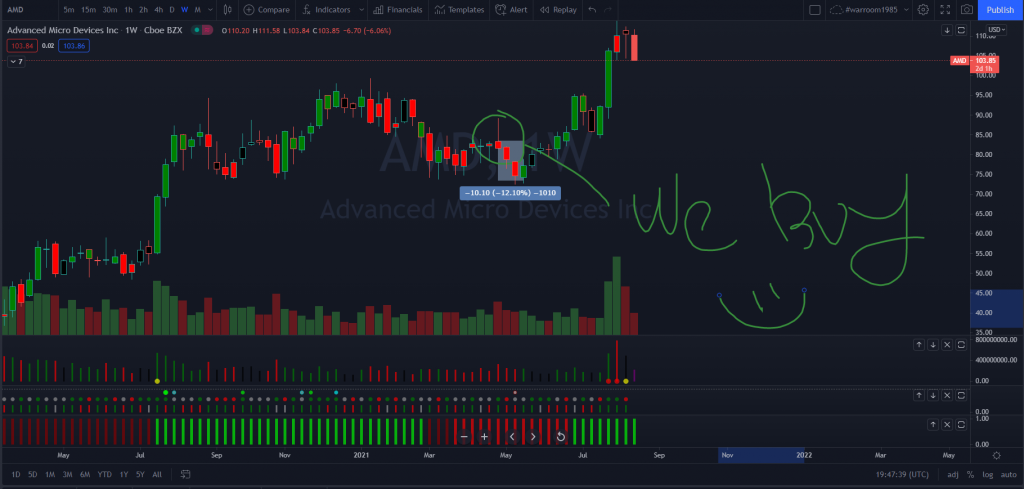
We ran into a small issue, though: the stock had a little more drawdown to go. So initially, we took a small unrealized loss. But trading is not a straight line. It’s impossible to enter a position at the best possible point every single time. We did our research and created a plan, so we were fine.
And it did, as you see in the picture above. Our options position jumped by 700%, with some members bringing home as high as 900%. This came on the back of AMD announcing strong earnings and revealing several big product announcements toward the end of July and early August.
The key component here was time. Without a plan and some patience, we would’ve second-guessed ourselves instead of waiting for take-off.
And once again, make sure to look at macro-level factors as part of your analysis before entering a trade.
I keep a watchlist of companies, as most traders do.
Sometimes, Statistical Disruptive Flow takes a while to trigger on these companies. But other times, it happens almost immediately on companies that I’m not even paying attention to.
One morning, as I was sitting down at my desk, fresh cup of coffee in hand…
Something caught my eye. My proprietary trading algorithm was flashing quite a rare SDF on Clover Health Investments Corporation (NASDAQ: CLOV), a health insurance company. I had to dive deeper into this potential trade to see what was up. Here’s what I noticed:

Look at that red rectangle around “short float.” That “short float” stat is the number of a stock’s floated (available for public trading) shares that have been shorted. That means 22.59% of CLOV’s shares were shorted.
That’s a lot of shorted shares. This could only mean one thing: people with a lot of capital — institutions — thought the price was going to drop. However, higher short float percentages increase the likelihood of a short squeeze.
I then looked at the chart below:
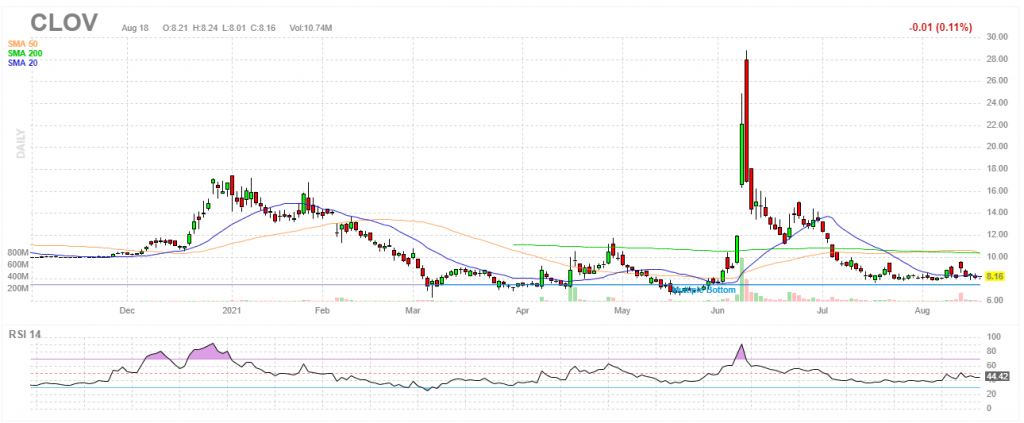
If you look closely at the far right of the chart, the volume’s building a little bit. That signaled a breakout. So I sent out a trade alert to buy CLOV 2021 Jul 16 15.00 Calls. We would sell half the contracts at a 400% gain and the other half when CLOV itself traded at $20/share.
But we didn’t have to wait long. The short squeeze I was imagining did happen. The stock gained by 200% overnight, triggering us to sell all our contracts…
And thanks to how options work, that translated to a 10X gain — 1,000% — in 24 hours.
Remember: I found each of these opportunities by looking “under the surface” in the market. I scan the market for where the big money is quietly being loaded into certain positions. By cross-checking with other factors — whether specific numerical data or macro-level world events — I can find trades with a strong likelihood of doing well and get in at the right time.
Now that I showed you a few examples of Statistical Disruptive Flow in action…
Click here to learn more about how you can use it to find trades like these!


